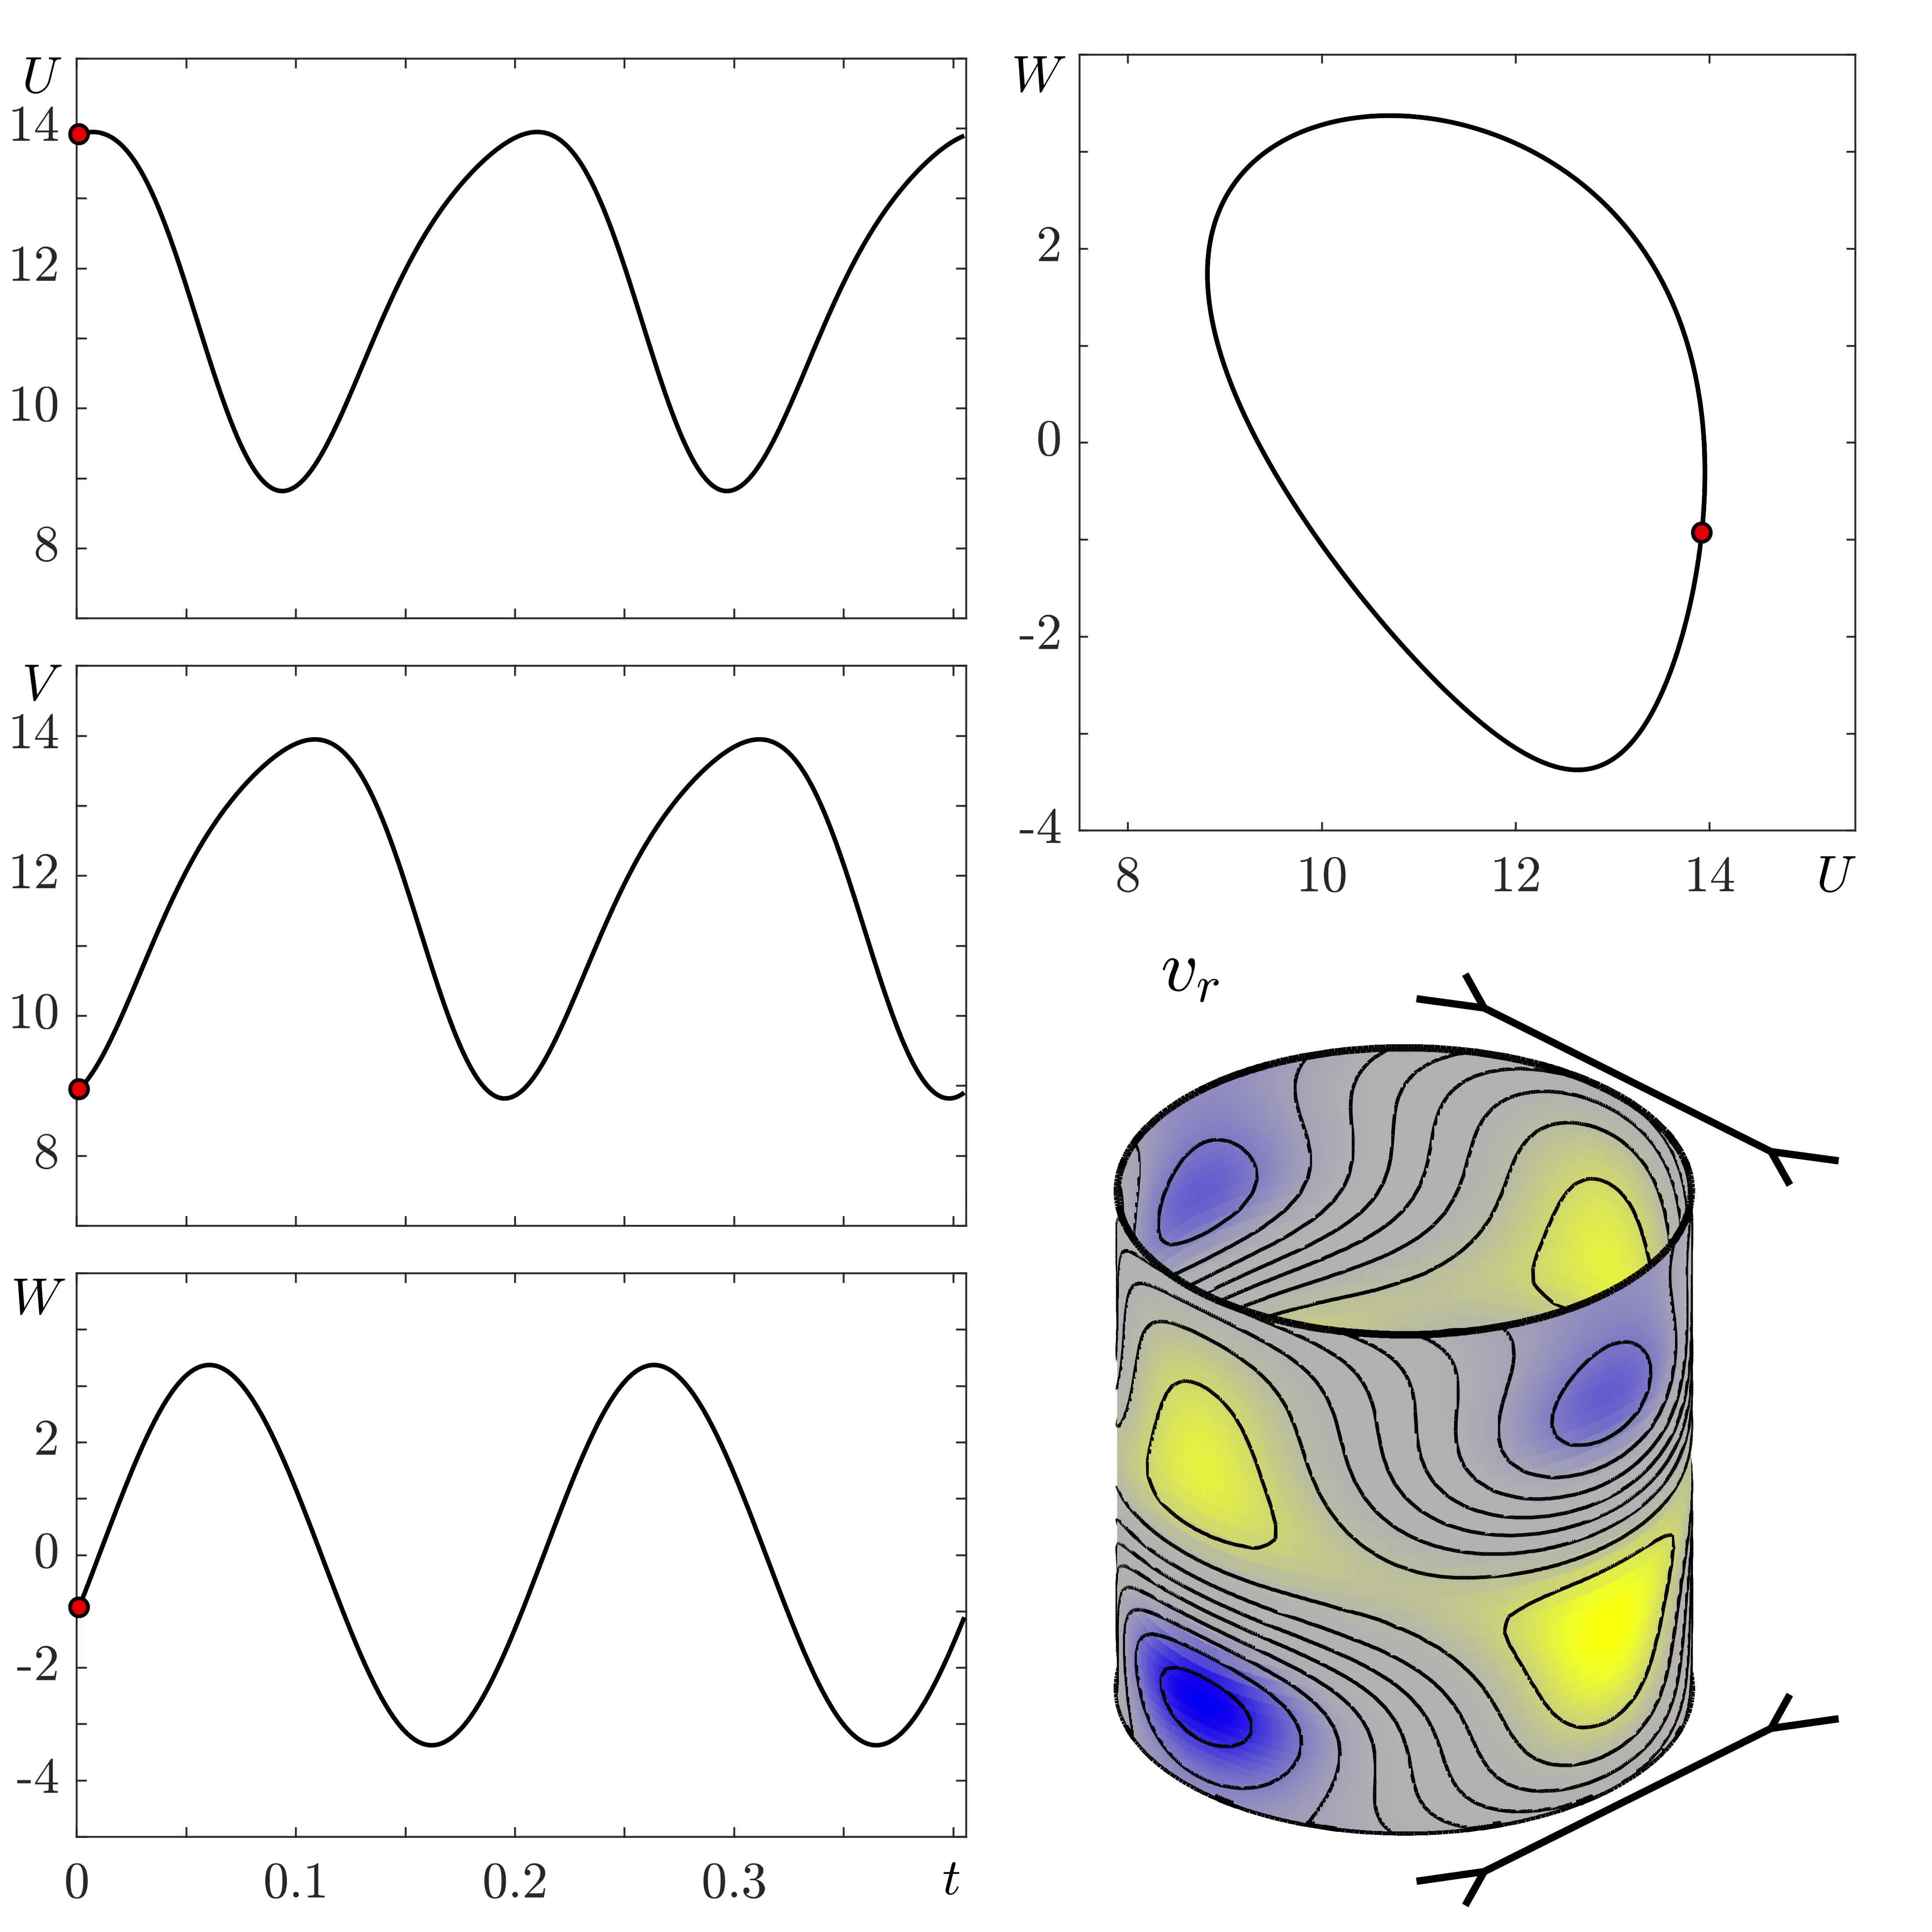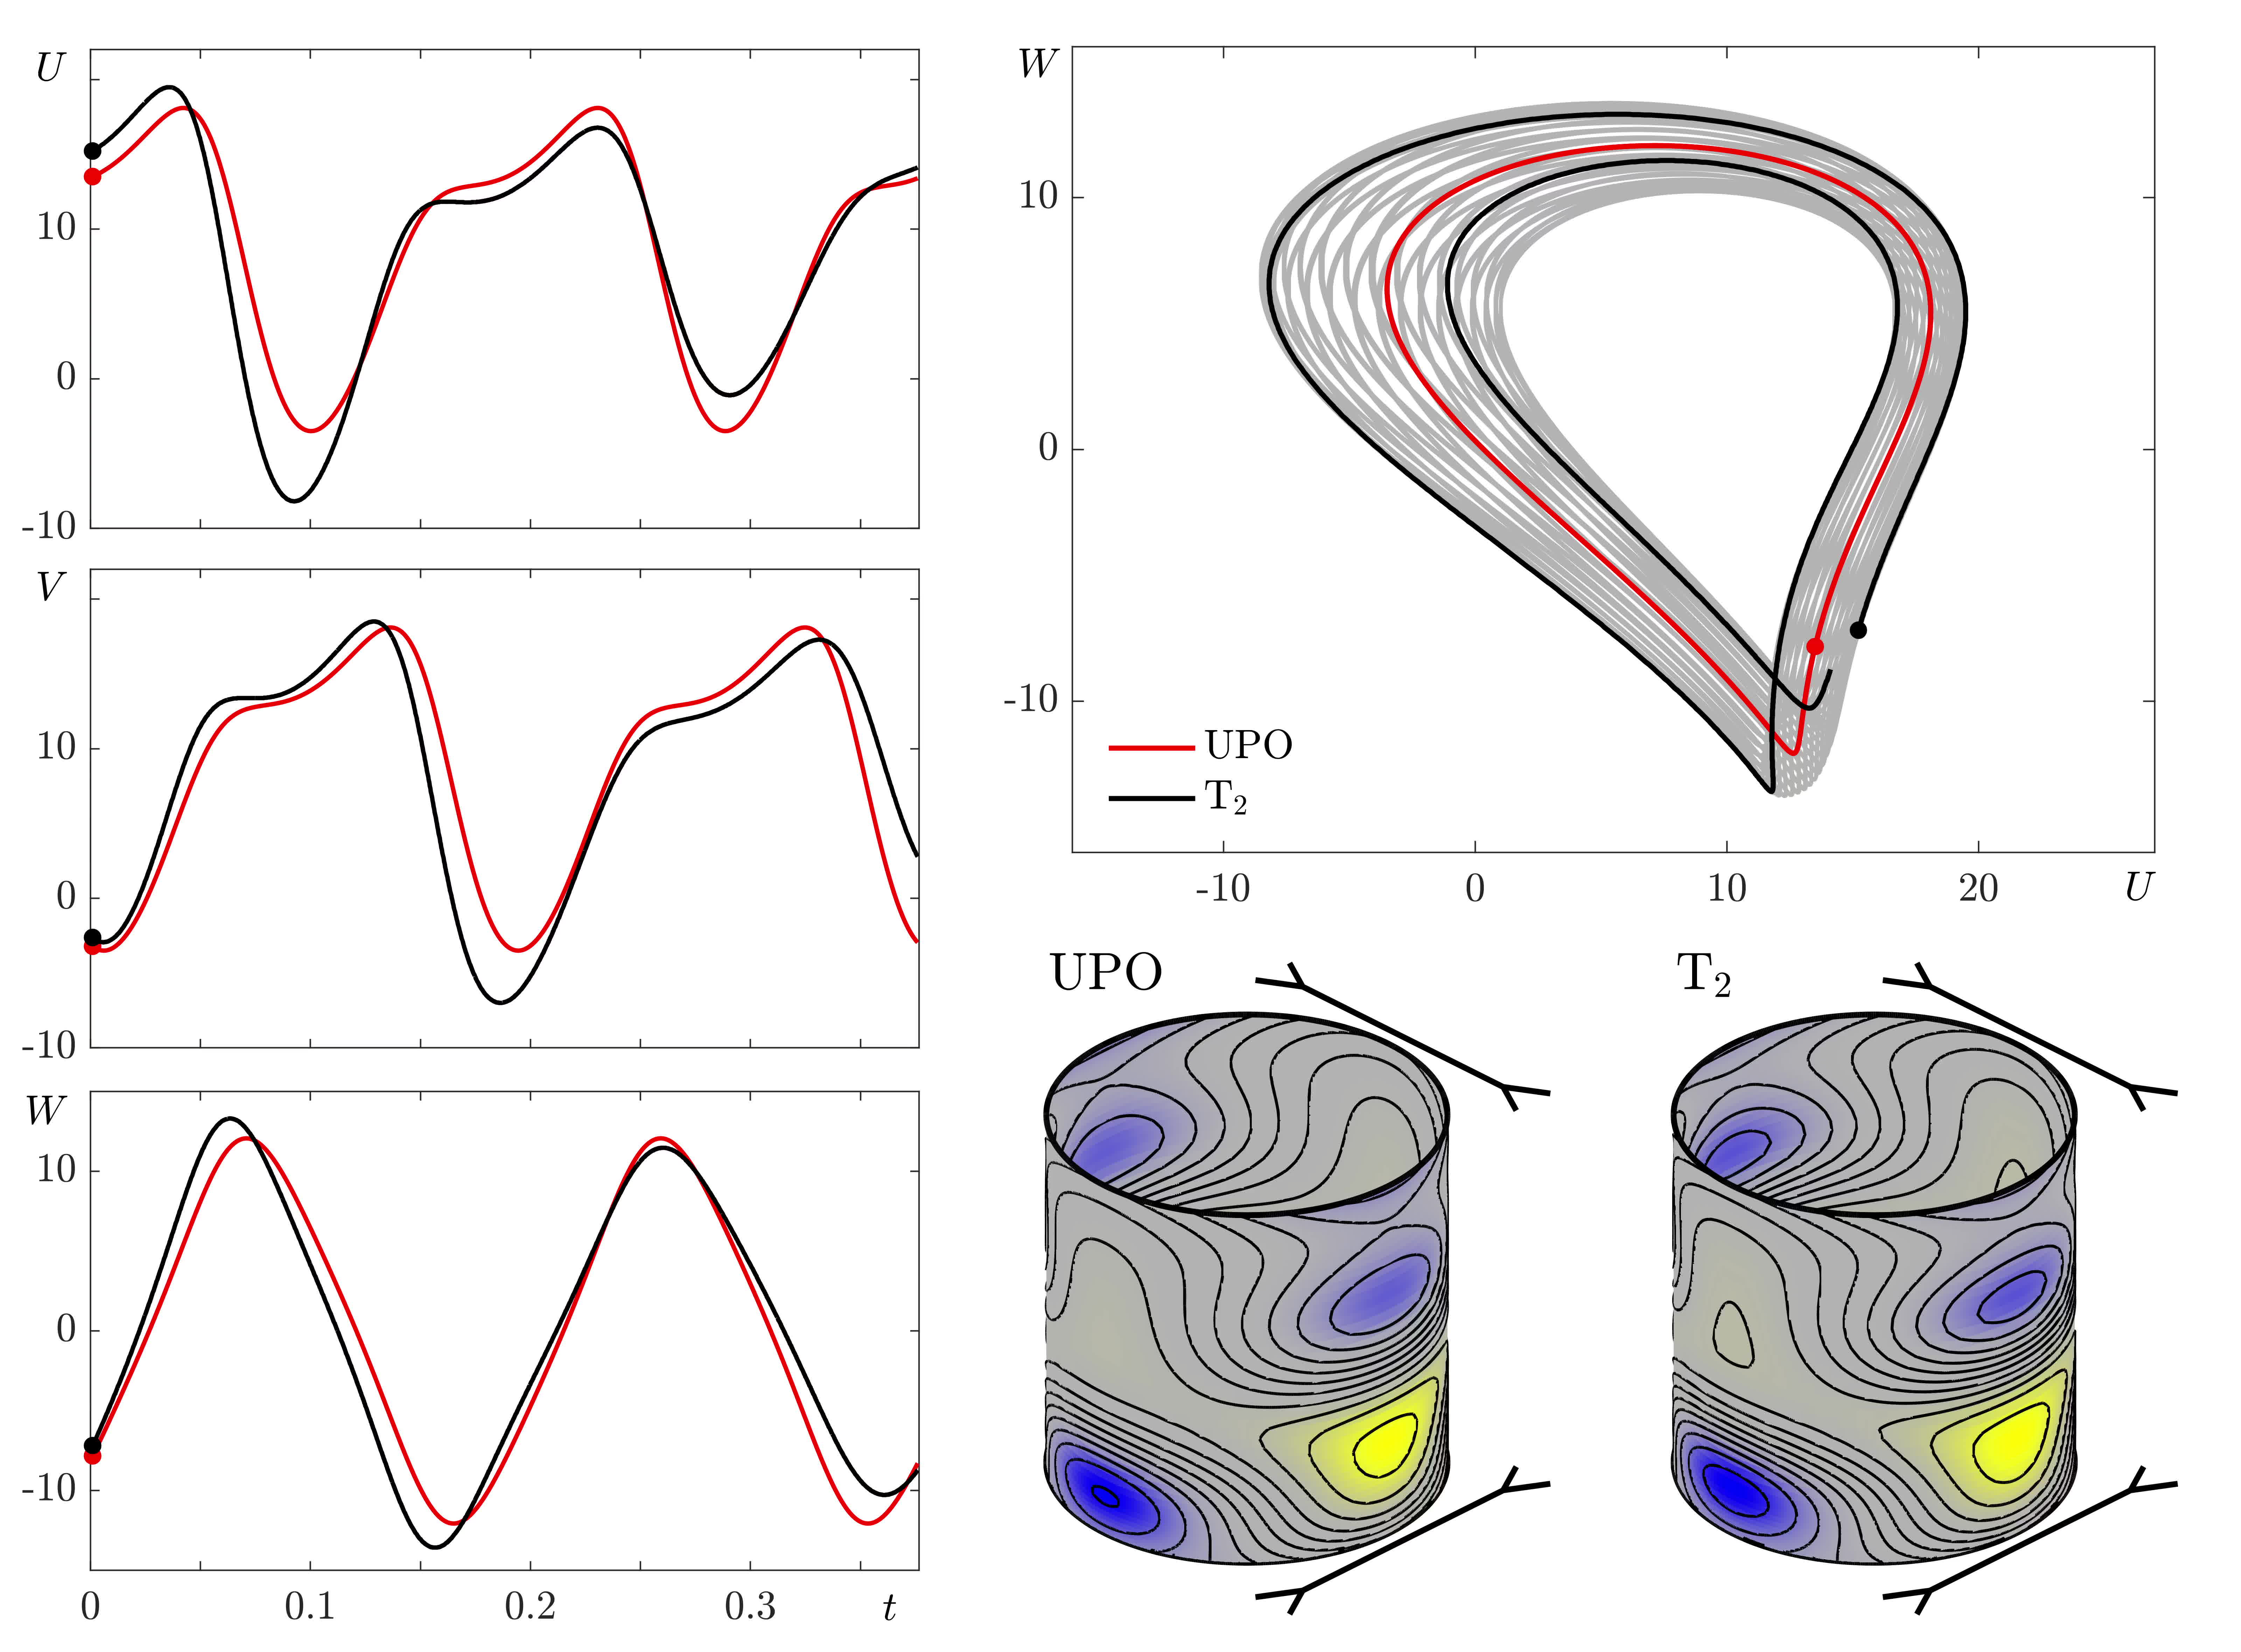

| (a) Figure 8: R=26, α=5π/4 | (b) Figure 12: Re=31.2, α=5π/4 |
 |
 |
Numerical simulations of flow between two orthogonaly stretching parallel plates. In each figure, the first column shows the time evolution of the velocity components, and the second column shows the (U,W)-phase portrait and isocontours of radial velocity vr . (a) Oscillatory flow for R=26 and α=5π/4. (b) Quasiperiodic flow for Re=31.2 and α=5π/4.